


Quantitative Aptitude DI
Feb 18 2021
Here we are providing new series of Quantitative Aptitude Questions for upcoming exams, so the aspirants can practice it on a daily basis.
Study the following information carefully and answer the questions given below.
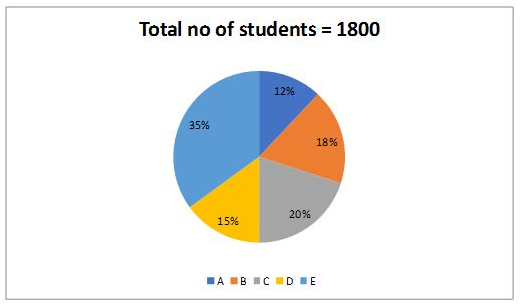
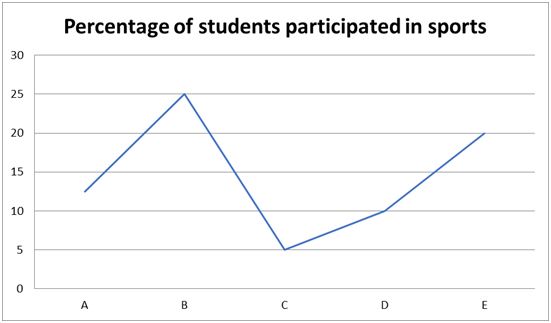
Pie chart shows the percentage of students in each class and line graph shows the percentage of students participated in sports.
1) What is the ratio of the number of students from E to the students participated in sports from C & D?
A) 14: 1
B) 1: 14
C) 13: 21
D) 21: 13
E) None of these
2) What % is the total number of students participated in sports from all the classes together?
A) 15.5%
B) 17.8%
C) 20.3%
D) 13.5%
E) None of these
3) Students participating in sports from C & D together are how much % more/less than the no. of students in A?
A) 71.72%
B) 73.15%
C) 79.16%
D) 76.18%
E) None of these
4) What is the difference between the no. of students participating sports in A & B together and the total no. of students in D & E together?
A) 792
B) 996
C) 874
D) 926
E) None of these
5) In which of the following, the no. of students participating sports is higher?
A) A
B) E
C) B
D) C
E) None of these
Directions (01 - 05):
1) Answer: A
Required ratio = 630: 45 => 126: 9 => 14: 1
2) Answer: A
Required percentage = 279/1800 * 100 = 15.5%
3) Answer: C
Required percentage = [(18 + 27) – 216]/216 * 100
= 171/216 * 100
= 79.16%
4) Answer: A
Required difference = 900 - 108 = 792
5) Answer: B
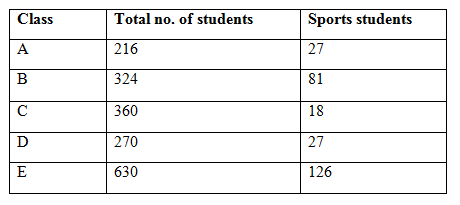
A – 27
B – 81
C – 18
D – 27
E – 126
Class E has maximum number of students participating in sports.